A system we built. The figures below are modelled at a representative scale rather than the client’s actual numbers, which are confidential — so you can substitute your own. How we build these numbers →
Challenge
Bike retailers struggle with unpredictable inventory levels due to extreme sales seasonality—from winter lulls to spring surges and summer peaks. This volatility creates a costly balancing act: overstock during slow periods ties up capital in holding costs, while understocking during peak seasons results in lost sales and disappointed customers.
Solution
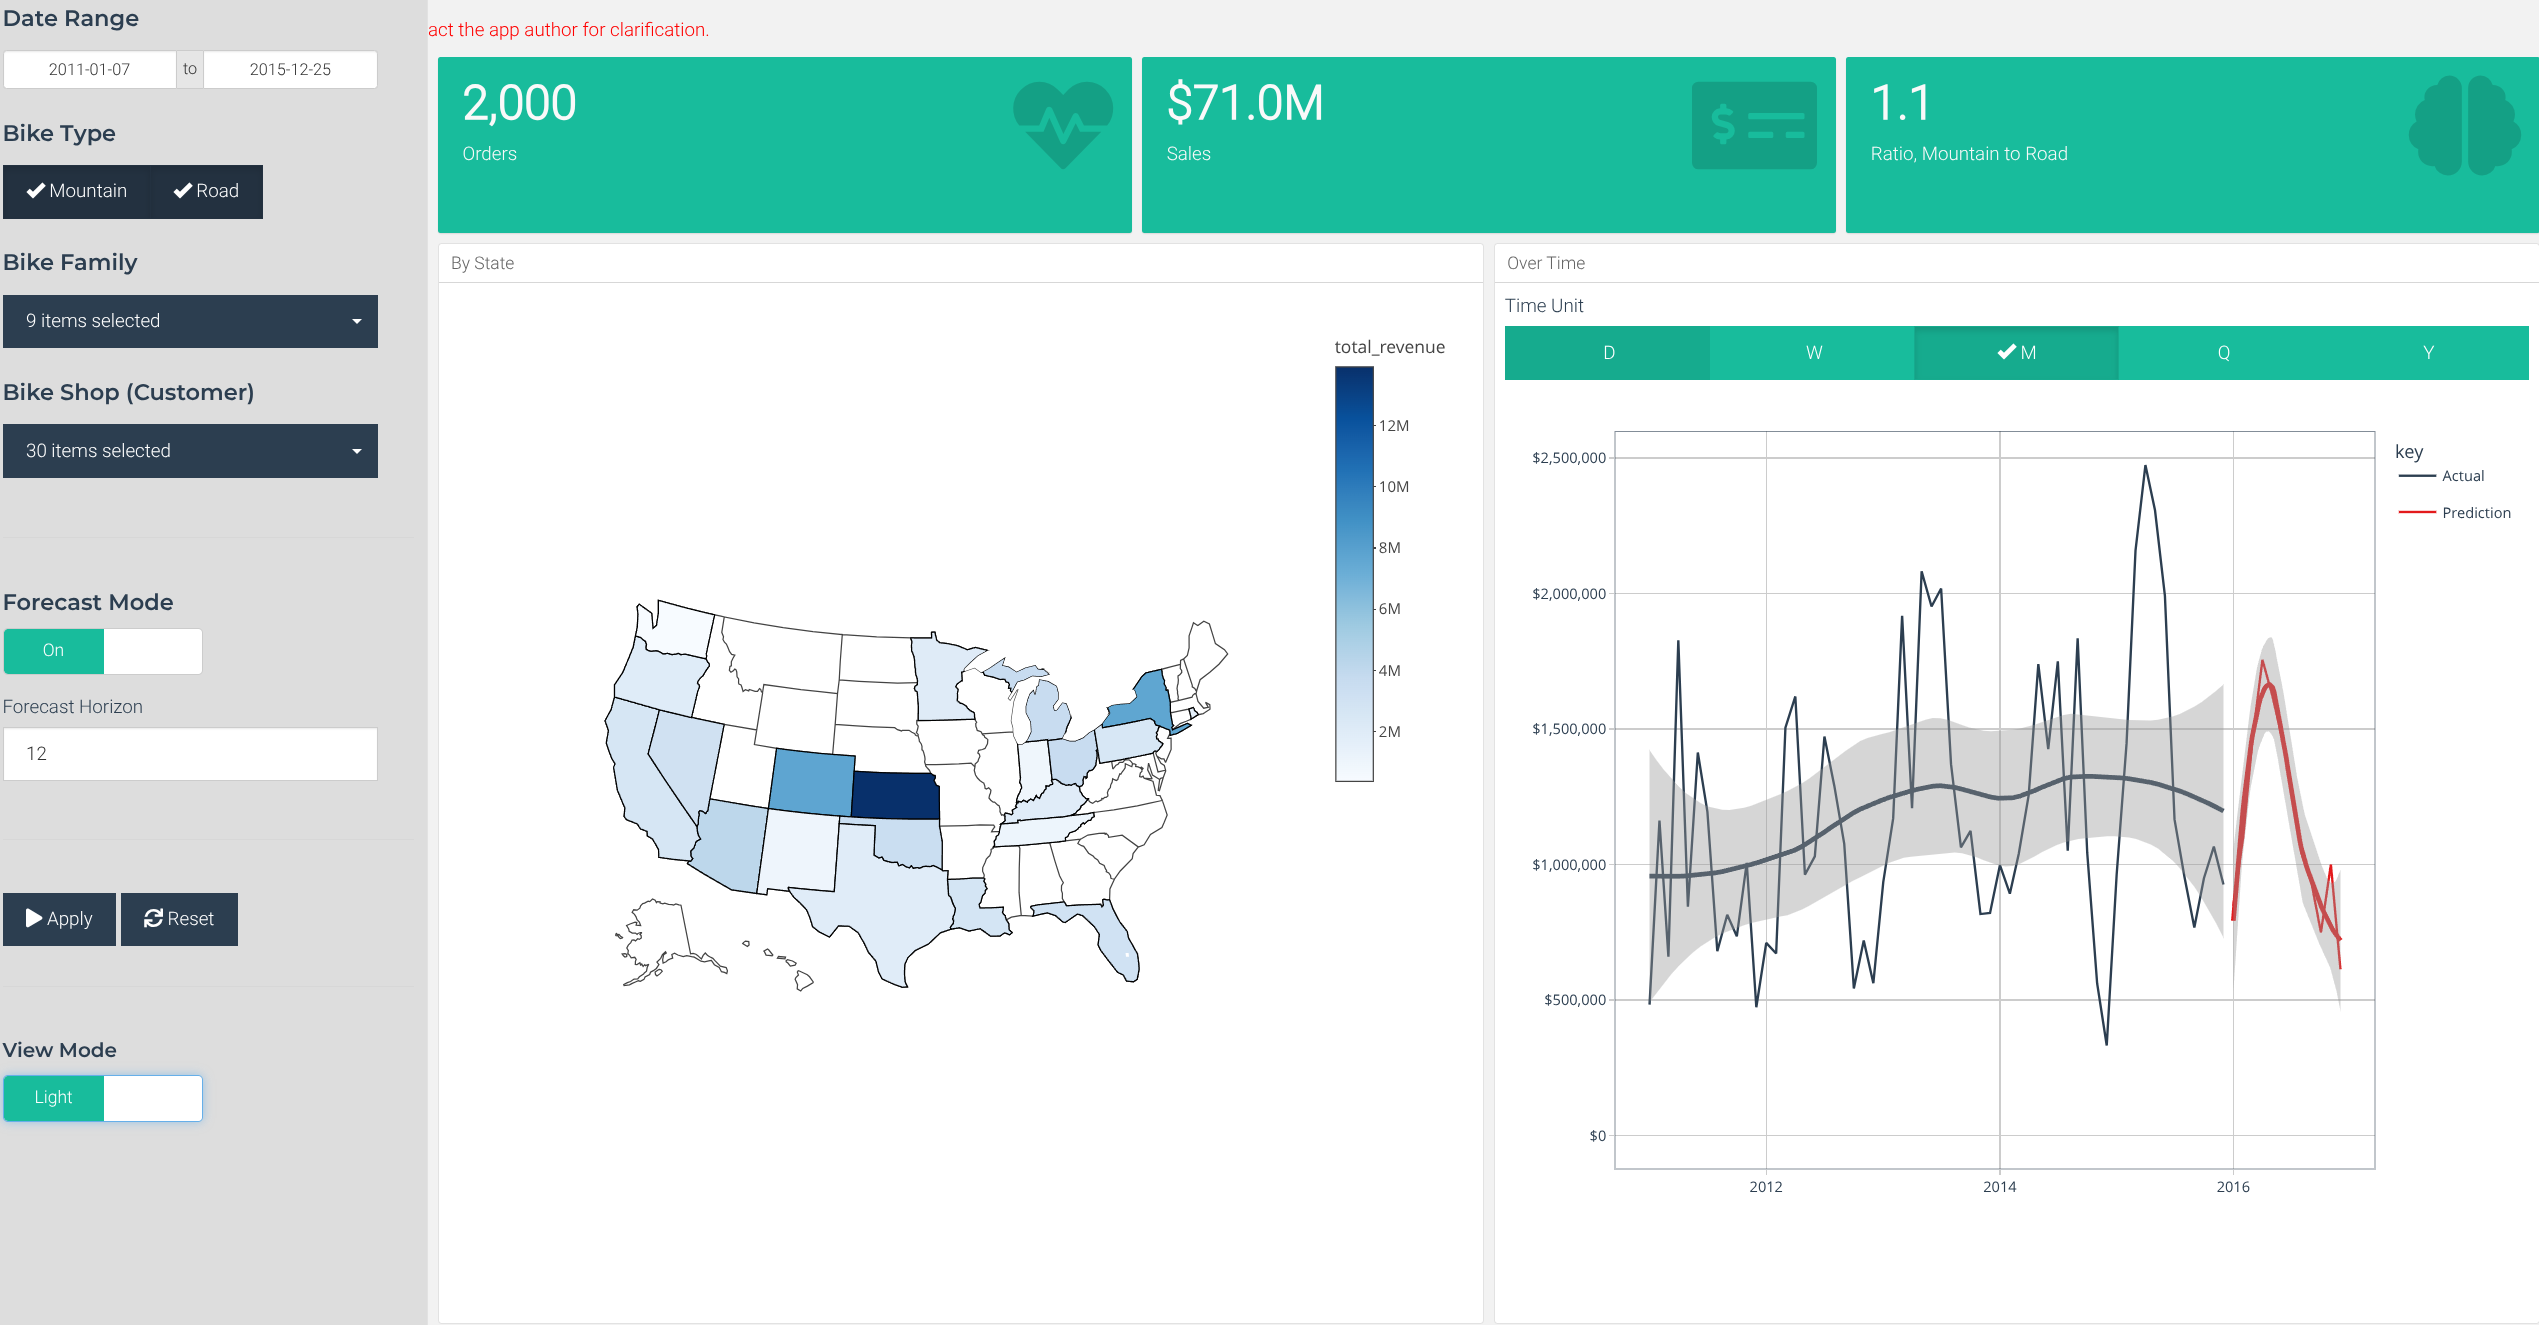
Interactive sales forecasting dashboard specifically designed for the bike retail market. The system analyzes historical sales patterns, seasonal trends, and market indicators to deliver accurate demand predictions with intuitive visualizations that enable retailers to make confident inventory decisions months in advance.
ROI
Worked at the scale of a mid-sized bike retailer on $5M annual revenue. Every figure comes from the inputs — swap them for yours and the outputs follow. How we build these numbers →
Inputs — what we assume about the business
| Assumption | Value |
|---|---|
| Annual revenue | $5M |
| Inventory carried at any one time | $1.5M |
| Peak-season sales lost to stockouts | $500K (10% of potential) |
| Holding costs — warehousing, insurance, financing | $250K/year |
| Emergency orders and end-of-season markdowns | $100K/year |
Outputs — what better forecasting changes
| Lever | Improvement | Arithmetic | Impact |
|---|---|---|---|
| Holding costs | down 15% | 15% × $250K | $38K |
| Stockouts | capture 25% of lost peak sales | 25% × $500K | $125K |
| Emergency orders and markdowns | down 50% | 50% × $100K | $50K |
| Total annual impact | $213K |
Scales roughly with revenue: about $425K at $10M, about $85K at $2M.
Halve every improvement rate and the case still returns $107K.
Benefits
- Seasonal Intelligence: Advanced algorithms capture complex seasonal patterns unique to bike sales, from weather-driven demand spikes to holiday purchasing behaviors, ensuring accurate forecasts across all seasons.
- Inventory Optimization: Precise demand predictions enable retailers to maintain optimal stock levels, reducing excess inventory costs while ensuring popular models are available when customers want them.
- Cash Flow Management: Better inventory planning frees up working capital by eliminating overstock situations, allowing retailers to invest in growth opportunities rather than warehouse storage.
- Regional Insights: Geographic analysis reveals location-specific demand patterns, helping multi-location retailers allocate inventory efficiently across their network.
- Trend Recognition: Early identification of emerging bike trends and category shifts allows retailers to capitalize on new opportunities before competitors.
- Risk Mitigation: Scenario planning features help retailers prepare for demand fluctuations caused by external factors like economic changes or supply chain disruptions.
- Decision Confidence: Real-time dashboard visualizations provide clear, actionable insights that eliminate guesswork from inventory planning and purchasing decisions.