A system we built. The figures below are modelled at a representative scale rather than the client’s actual numbers, which are confidential — so you can substitute your own. How we build these numbers →
Challenge
Retail companies struggle to set optimal prices for products across different markets, categories, and regions, especially when expanding to new territories or launching products in untested segments. Without data-driven pricing strategies, retailers either leave money on the table with conservative pricing or lose sales with overpriced products, while lacking visibility into how product attributes and market dynamics should influence pricing decisions.
Solution
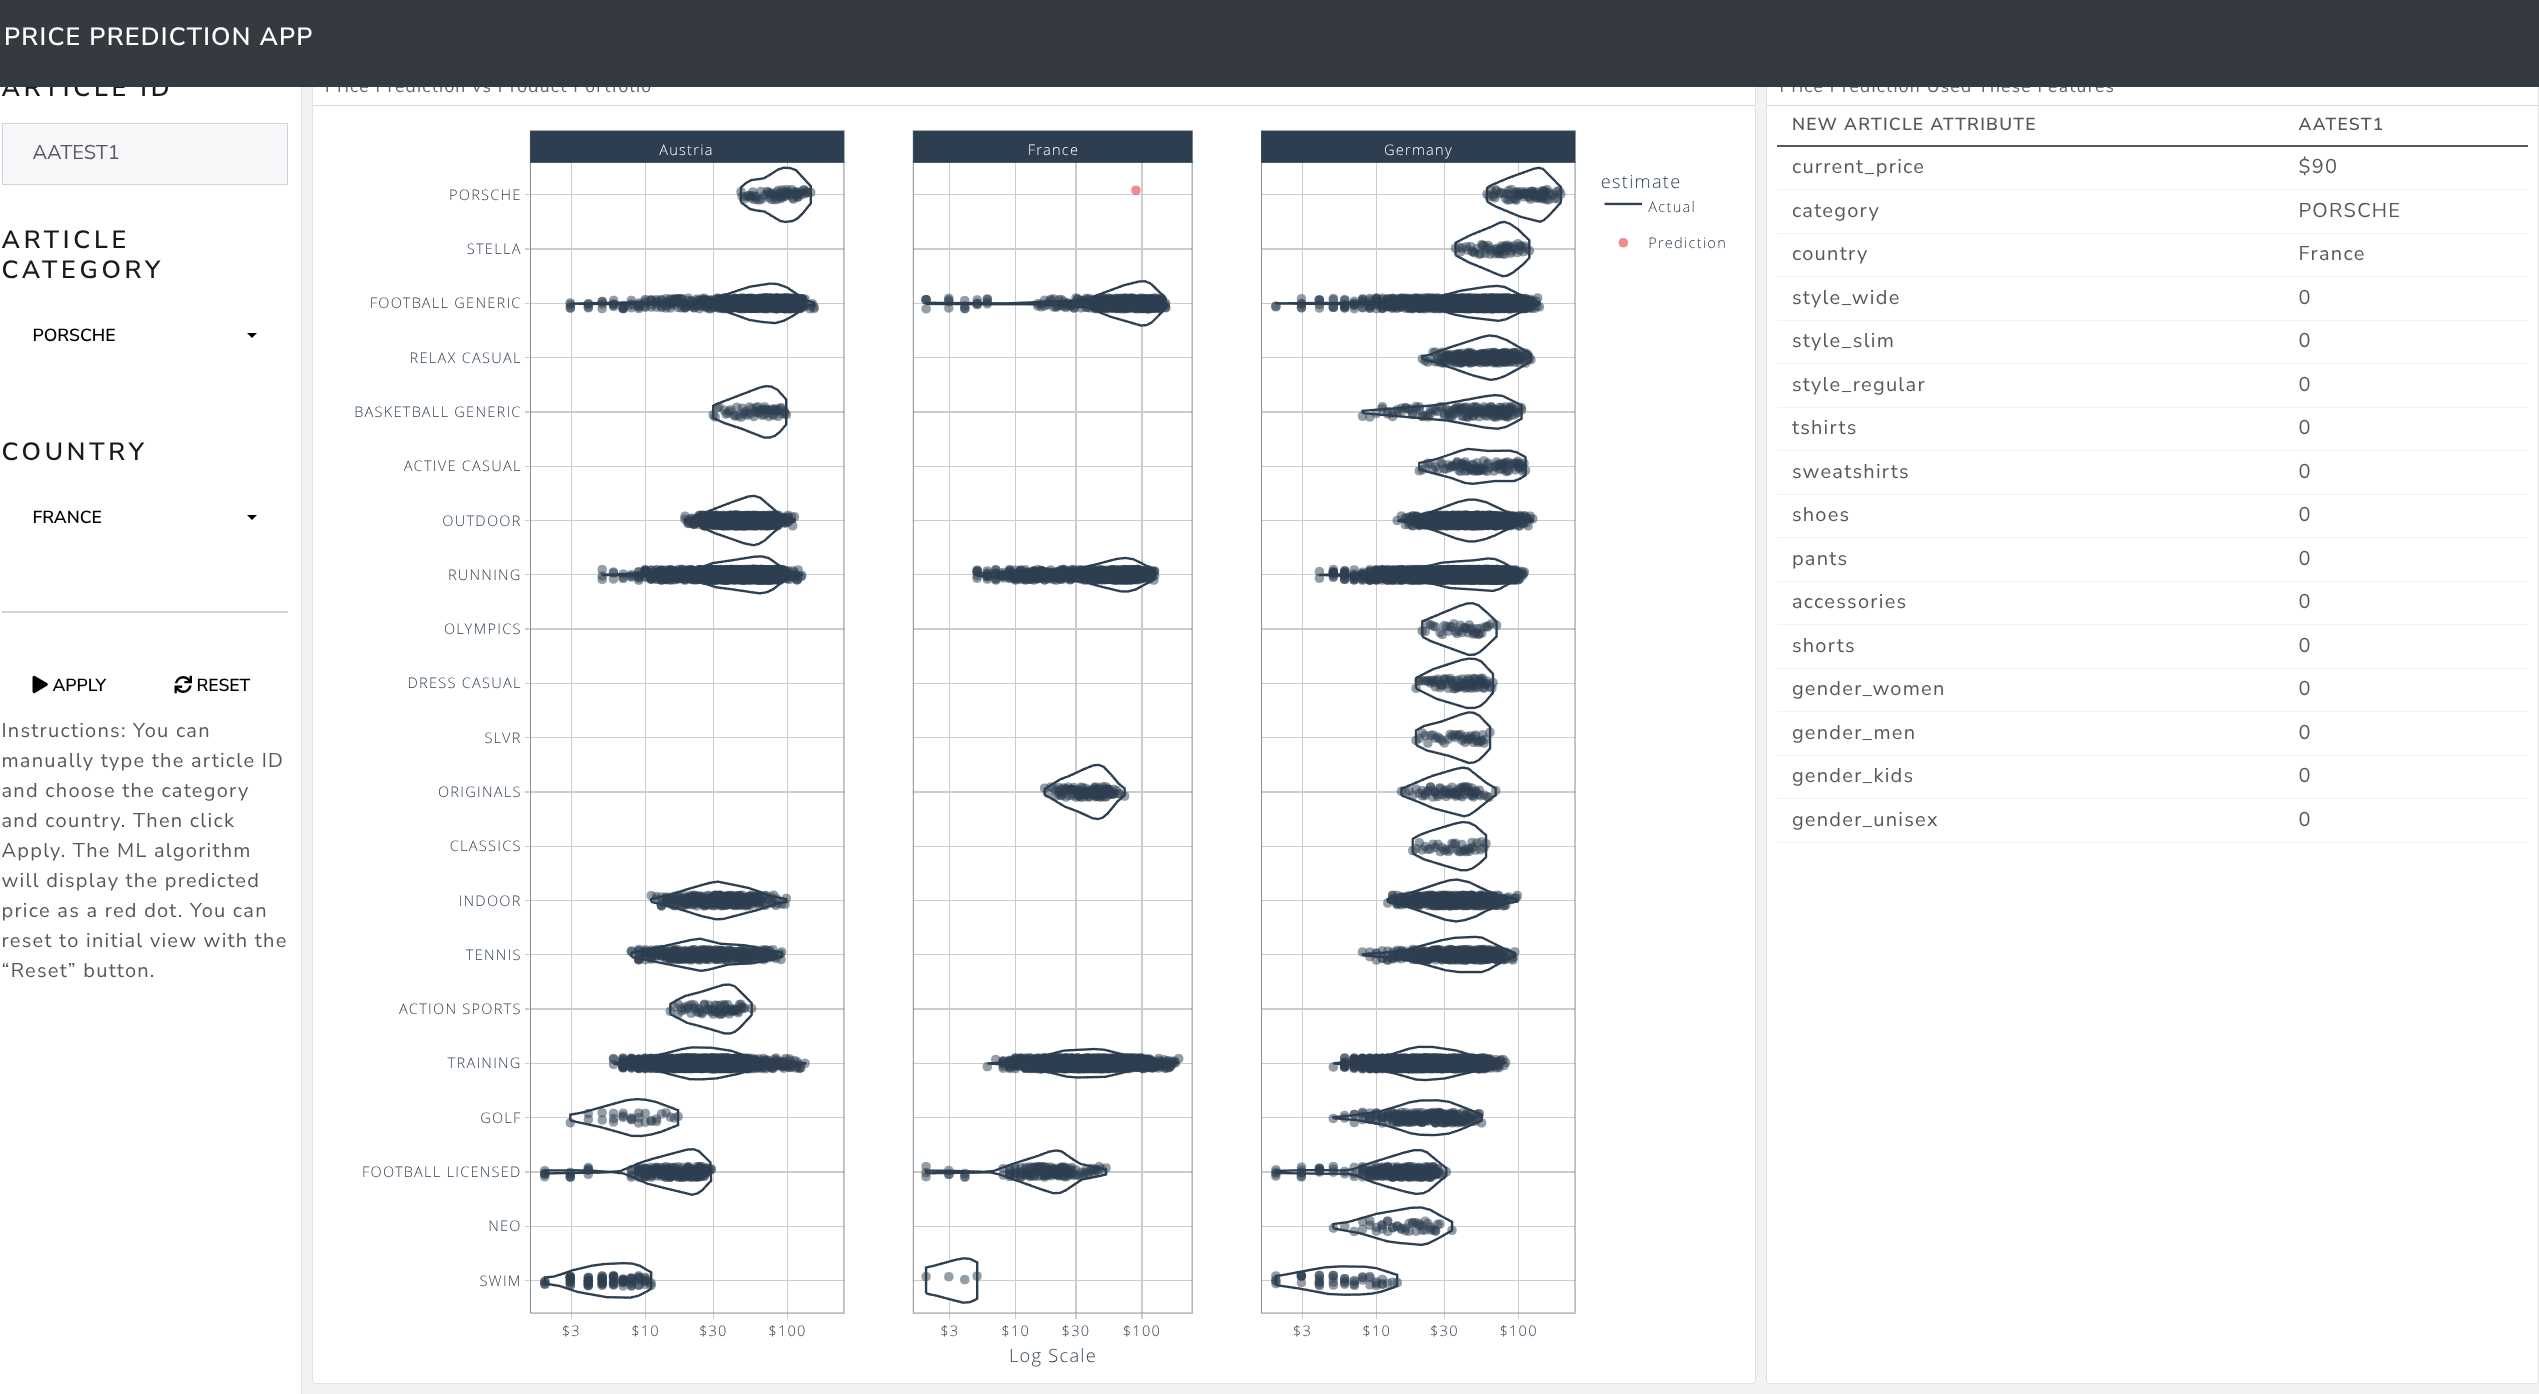
Interactive price prediction dashboard powered by machine learning algorithms that analyze product portfolios, regional market data, and category performance to recommend optimal pricing strategies. The system enables retailers to predict prices for new products, unexplored markets, or category expansions by leveraging patterns from existing successful products across their entire portfolio.
ROI
Worked at the scale of a fashion retailer with 5,000 SKUs across 10 countries on $50M annual revenue. Every figure comes from the inputs — swap them for yours and the outputs follow. How we build these numbers →
Inputs — what we assume about the business
| Assumption | Value |
|---|---|
| Annual revenue | $50M |
| SKUs | 5,000 across 10 countries |
| Revenue lost to suboptimal pricing on new market entries | $2M/year |
| Revenue missed on underpriced high-demand categories | $1.5M/year |
| Inventory sitting overpriced for its region | $800K/year |
| External pricing consultants and market research | $300K/year |
Outputs — what price prediction changes
| Lever | Improvement | Arithmetic | Impact |
|---|---|---|---|
| New market entries | 60% of the pricing loss recovered | 60% × $2M | $1.2M |
| Underpriced categories | 60% of missed margin captured | 60% × $1.5M | $900K |
| Regional overpricing | 75% of lost sales recovered | 75% × $800K | $600K |
| External pricing research | replaced, down 83% | 83% × $300K | $250K |
| Total annual impact | $2.95M |
Also shortens pricing decisions for a new launch from 3–6 months to weeks.
Scales across retail categories — electronics, home goods and luxury.
Benefits
- Cross-Market Intelligence: Advanced algorithms identify pricing patterns across regions and categories, enabling confident expansion into new markets with data-backed pricing strategies rather than guesswork.
- Portfolio Optimization: Comprehensive analysis of existing product performance reveals underpriced winners and overpriced laggards, allowing systematic margin improvement across entire catalogs.
- Real-Time Adaptation: Interactive dashboard enables instant price testing and scenario planning, allowing retailers to quickly respond to market changes and competitive pressures.
- Gap Analysis: Identifies pricing opportunities for products not yet available in specific regions or categories, revealing expansion opportunities with pre-validated pricing strategies.
- Risk Mitigation: Data-driven predictions reduce pricing mistakes that can damage brand positioning or result in unsellable inventory, protecting both revenue and brand equity.
- Competitive Advantage: Systematic pricing optimization creates sustainable competitive moats by maximizing both market penetration and profitability simultaneously.
- Strategic Planning: Long-term pricing insights inform product development, market entry decisions, and inventory planning with confidence in financial projections.