A system we built. The figures below are modelled at a representative scale rather than the client’s actual numbers, which are confidential — so you can substitute your own. How we build these numbers →
Challenge
Companies across industries struggle to understand which marketing channels truly drive business growth, often making budget allocation decisions based on incomplete attribution data. Traditional methods fail to capture cross-channel effects and diminishing returns, leading to systematic under-investment in high-performing channels while continuing to fund ineffective campaigns that drain marketing ROI.
Solution
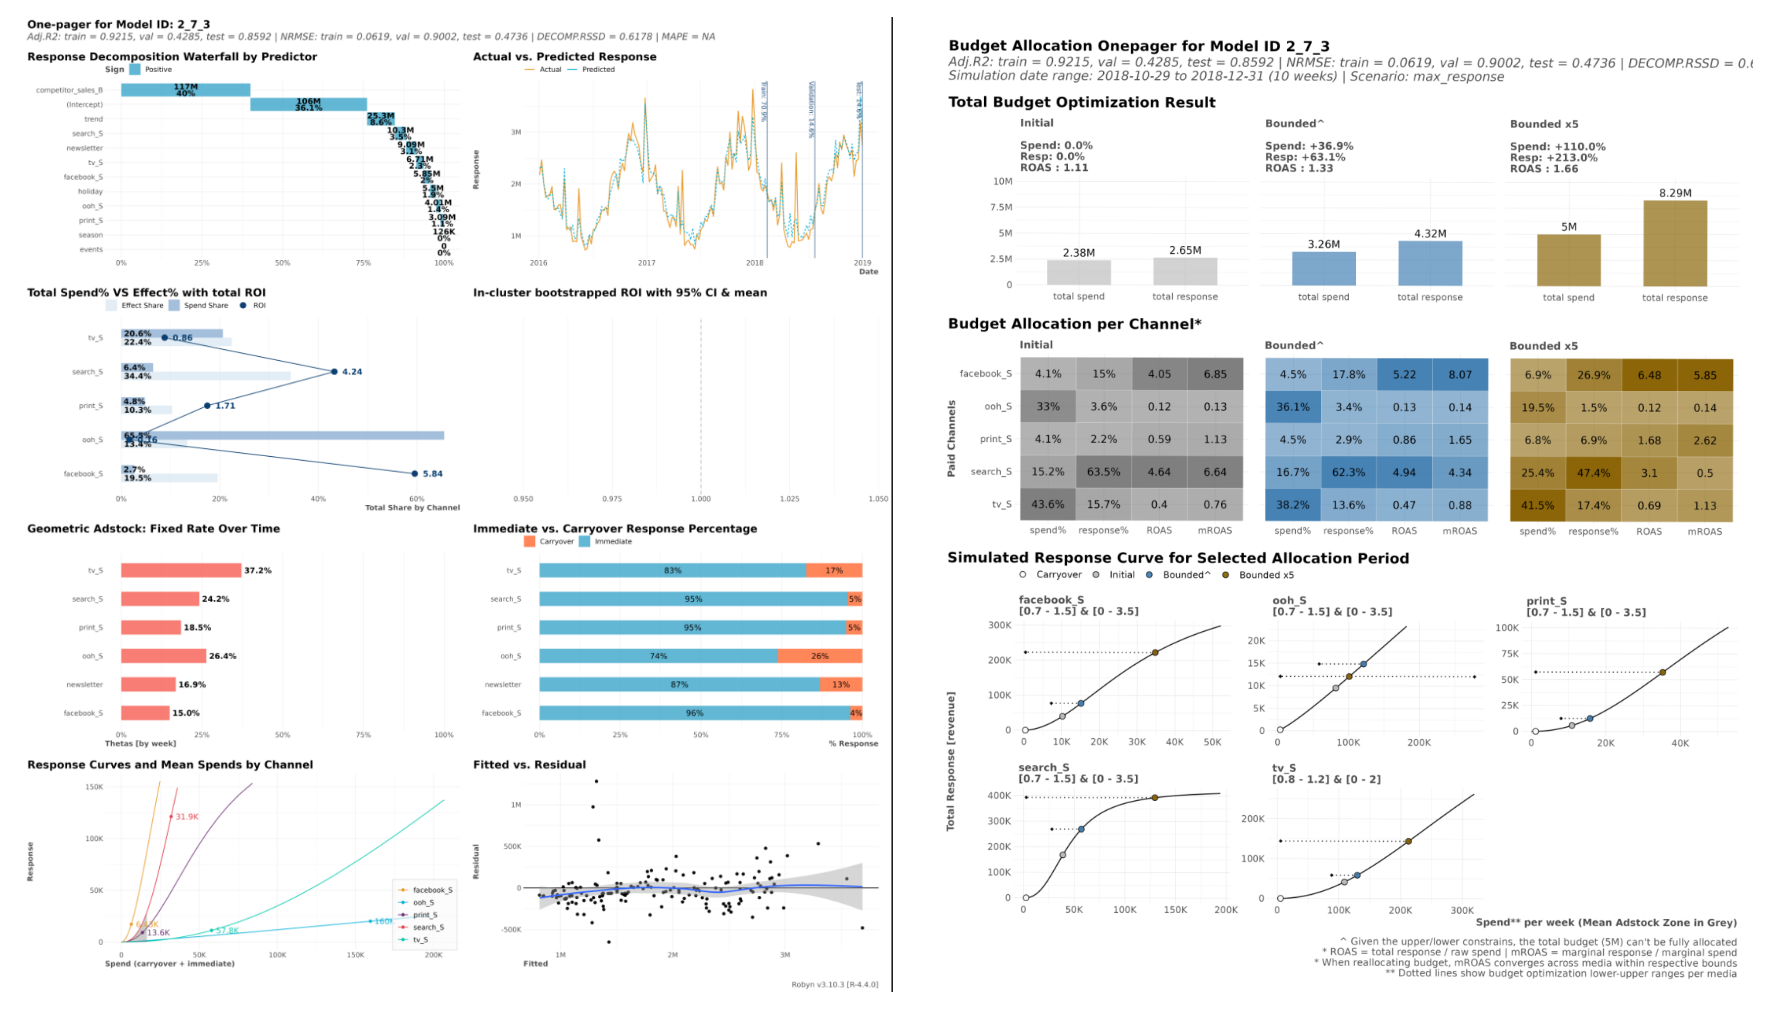
Advanced marketing mix modeling using Meta’s Robyn open-source framework to decode true channel attribution and optimize budget distribution across all marketing touchpoints. Through comprehensive statistical analysis and media saturation curves, the solution quantifies incremental contribution of each channel and provides actionable recommendations for maximum marketing effectiveness across e-commerce and pharmaceutical industries.
ROI
Worked at the scale of an e-commerce retailer spending $2M a year on marketing to generate $20M in revenue. Every figure comes from the inputs — swap them for yours and the outputs follow. How we build these numbers →
Inputs — what we assume about the business
| Assumption | Value |
|---|---|
| Annual marketing spend | $2M |
| Annual revenue attributed to marketing | $20M (10:1 ROAS) |
| Budget misallocated through unclear channel performance | $500K/year |
| Revenue forgone by under-funding high-ROI channels | $1M/year |
| Spend continuing into saturated, diminishing-return channels | $300K/year |
Outputs — what mix modelling changes
| Lever | Improvement | Arithmetic | Impact |
|---|---|---|---|
| Under-funded channels | 75% of forgone revenue recovered | 75% × $1M | $750K |
| Saturated channels | spend down 40% | 40% × $300K | $120K |
| Channel interaction effects | 60% of the misallocation corrected | 60% × $500K | $300K |
| Total annual impact | $1.17M |
Effect on ROAS: about 11:1, up from 10:1 — $21.05M of revenue on $1.88M of spend.
The framework applies across industries; pharmaceutical clients run it across professional marketing, DTC campaigns and conference investment.
Benefits
- True Incremental Impact: Sophisticated statistical modeling separates correlation from causation, revealing which channels actually drive incremental business growth versus those riding on organic trends.
- Cross-Industry Expertise: Proven methodology works equally well for e-commerce customer acquisition and pharmaceutical professional engagement, adapting to different sales cycles and attribution windows.
- Media Saturation Analysis: Advanced curve modeling identifies optimal spend levels for each channel, preventing waste on over-saturated channels while uncovering scaling opportunities.
- Budget Optimization: Data-driven reallocation strategies maximize return on marketing investment by directing spend toward channels with highest incremental contribution potential.
- Strategic Planning: Long-term modeling enables informed budget planning across quarters and seasons, accounting for external factors and competitive dynamics.
- Channel Synergies: Reveals hidden interactions between marketing channels, enabling coordinated campaigns that amplify overall effectiveness beyond individual channel performance.
- Measurable Results: Quantifiable improvements in marketing efficiency provide clear ROI justification and build confidence in data-driven marketing decisions.