A system we built. The figures below are modelled at a representative scale rather than the client’s actual numbers, which are confidential — so you can substitute your own. How we build these numbers →
Challenge
Customer support teams struggle with overwhelming ticket volumes, inconsistent prioritization, and poor resource allocation that leads to missed SLAs, frustrated customers, and agent burnout. Traditional support systems lack predictive capabilities, forcing reactive responses to customer issues while providing no visibility into resolution patterns, churn risks, or optimization opportunities that could transform support from a cost center into a competitive advantage.
Solution
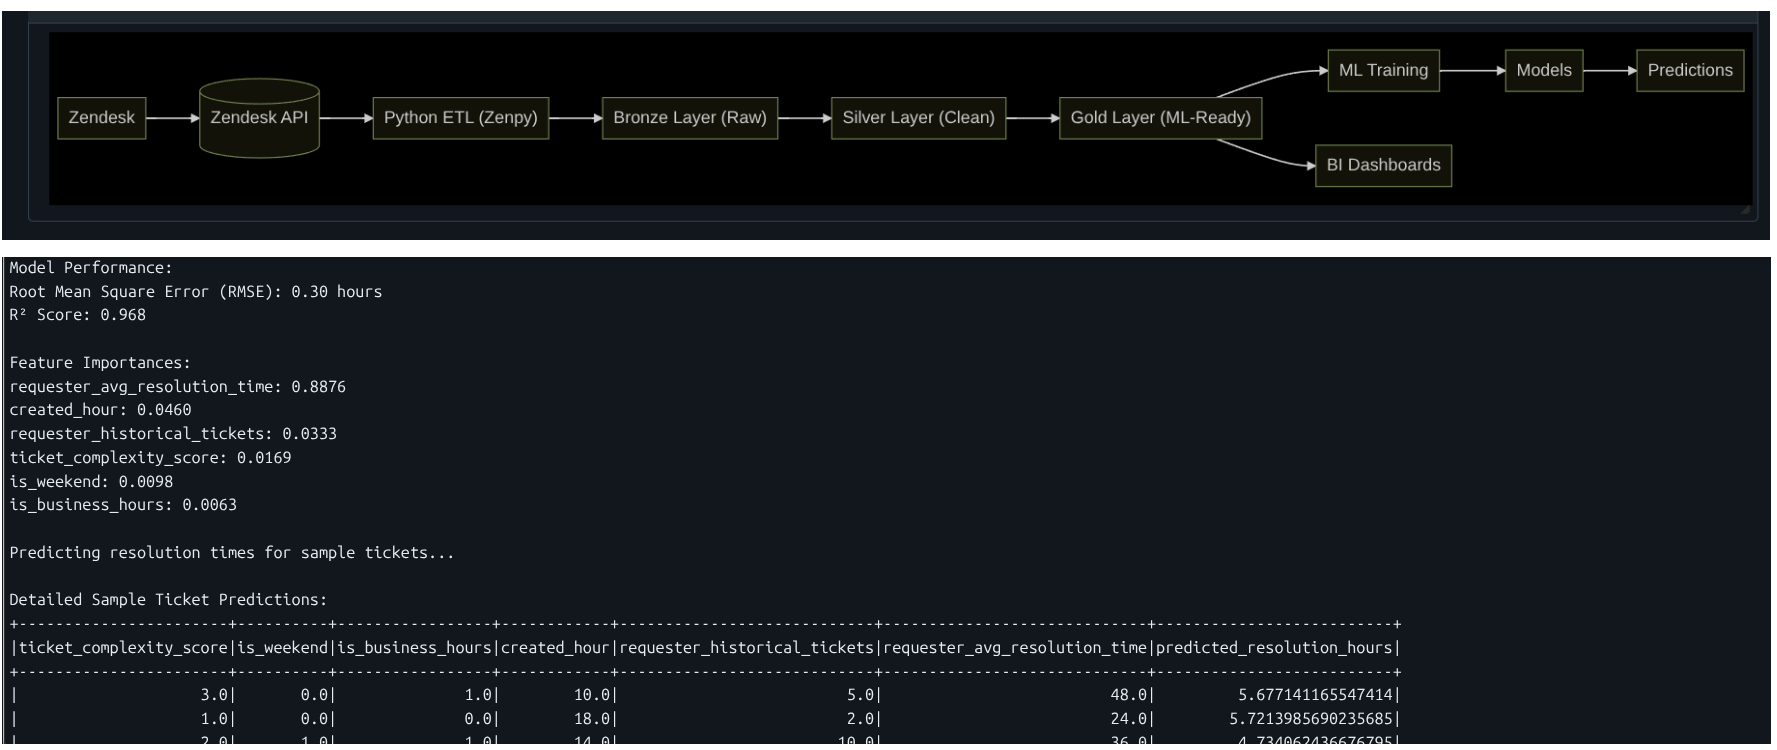
Advanced customer support intelligence platform built on Zendesk data pipeline architecture using Databricks for scalable analytics. The system transforms raw ticket data through bronze, silver, and gold layers to deliver ML-powered insights including automatic priority assignment, resolution time predictions, churn risk identification, optimal agent matching, and intelligent ticket categorization.
ROI
Worked at the scale of an enterprise handling 100,000 support tickets a year with a 50-person team. Every figure comes from the inputs — swap them for yours and the outputs follow. How we build these numbers →
Inputs — what we assume about the business
| Assumption | Value |
|---|---|
| Support tickets per year | 100,000 |
| Support team | 50 people |
| Revenue lost to churn caused by poor support | $2M/year |
| Inefficient agent allocation and overtime | $800K/year |
| Contract penalties at risk from missed SLAs (30% of tickets) | $1.2M/year |
| Manual ticket routing and prioritisation overhead | $400K/year |
Outputs — what support analytics changes
| Lever | Improvement | Arithmetic | Impact |
|---|---|---|---|
| SLA penalties | most of the exposure avoided | 83% × $1.2M | $1M |
| Resolution time | down 35% | 35% × $800K | $280K |
| Support-driven churn | three quarters retained | 75% × $2M | $1.5M |
| Manual routing | down 75% | 75% × $400K | $300K |
| Staffing to forecast ticket volume | remainder of the allocation waste | 25% × $800K | $200K |
| Total annual impact | $3.28M |
Operational effect: average resolution time falls from 48 hours to 31.
Benefits
- Predictive Prioritization: Machine learning automatically assigns ticket urgency based on complexity scores, customer history, and impact analysis, ensuring critical issues receive immediate attention while optimizing resource allocation.
- Resolution Forecasting: Accurate predictions of ticket resolution times enable better SLA management, realistic customer expectations, and proactive capacity planning for peak support periods.
- Churn Risk Detection: Advanced analytics identify customers showing support-related churn signals through ticket patterns, resolution satisfaction, and interaction complexity trends.
- Intelligent Agent Matching: Optimal ticket assignment based on agent expertise, current workload, and historical performance patterns maximizes first-contact resolution rates and customer satisfaction.
- Automated Categorization: Natural language processing eliminates manual ticket routing, ensuring faster response times and consistent categorization across all support channels.
- Scalable Architecture: Databricks-powered pipeline handles massive ticket volumes with bronze-silver-gold data layers that ensure data quality, feature engineering, and ML-ready datasets.
- Strategic Insights: Executive dashboards reveal support trends, customer satisfaction drivers, and operational bottlenecks that inform strategic decisions about support investment and process improvements.